-
About Us
-
ServicesSEOPaid AdsWeb Design & DevelopmentContent MarketingAccount Based MarketingSales Optimization
-
Our Work
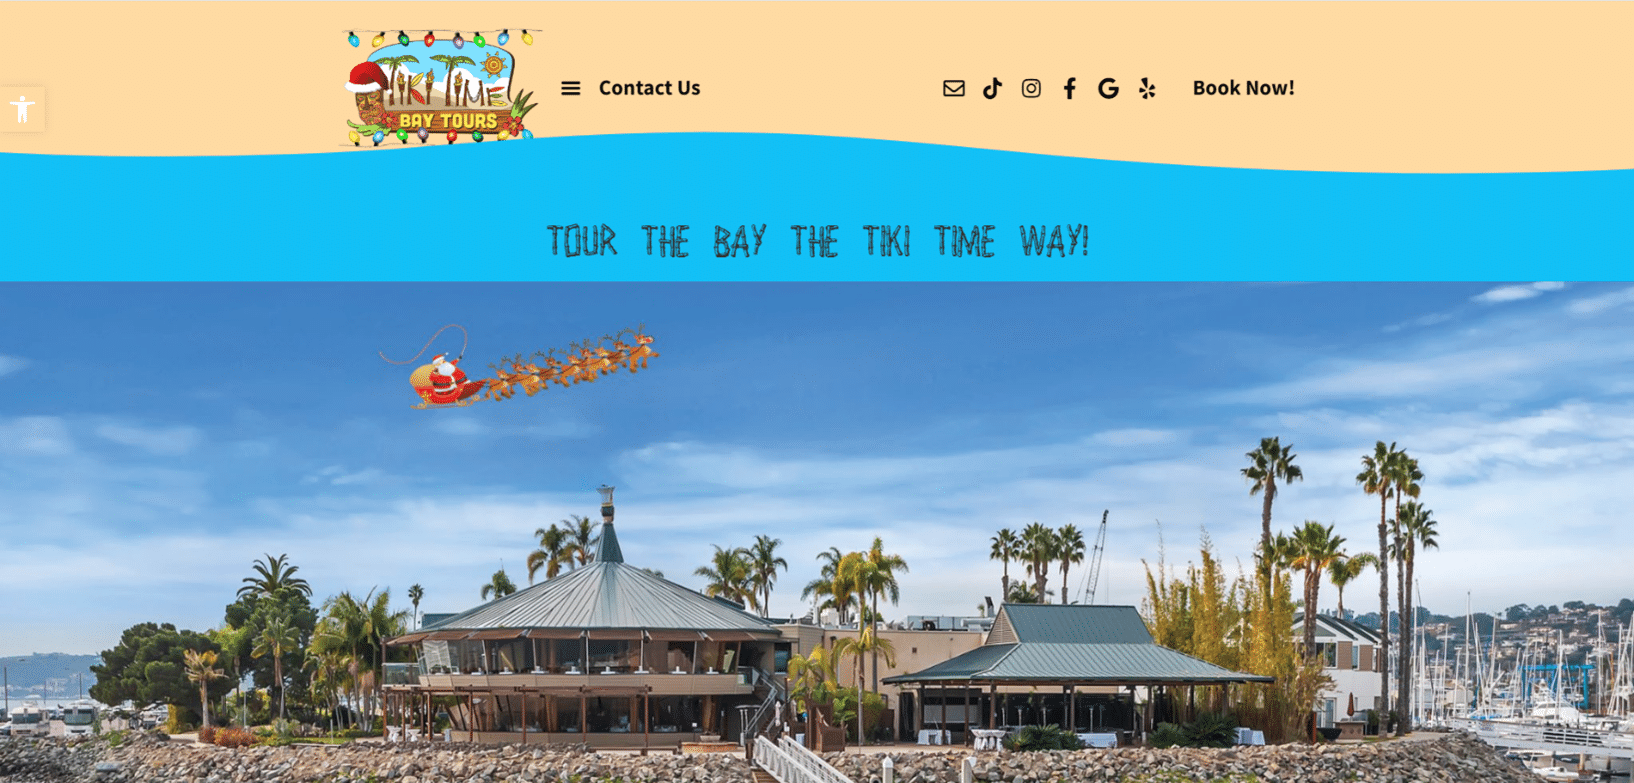
Tiki Time Bay Tours is a cruising tours company in San Diego California. Tiki Time offers an immersive guided entertainment experience, with cruise tour packages spanning from sunset cruises to a 21 and over Tiki Tonic cruise.
increase in ROI (ROAS)
increase in purchase conversion
increase in purchase conversion value

Tiki Time Bay Tours is a cruising tours company in San Diego California. Tiki Time offers an immersive guided entertainment experience, with cruise tour packages spanning from sunset cruises to a 21 and over Tiki Tonic cruise.
increase in ROI (ROAS)
increase in purchase conversion
increase in purchase conversion value
Tiki Time Bay Tours approached Ruby Digital with the primary goal of conversions to increase the number of website tour bookings through integrated paid marketing advertising (Paid Social and Google Advertising).
We started running Ads from June 2023.


A challenge experienced was that prior to us beginning our Integrated Paid Marketing (Meta Ads and Google Ads) strategy implementation, the ad account was unable to track revenue alongside an accurate depiction of conversions (bookings).
This meant that both Meta & Google were unable to accurately learn what a good conversion value was and thus wasn’t able to optimise for valuable conversions.
Prior to implementing the Integrated Paid Marketing strategy, Tiki Time Bay Tours was still using the soon to be sunset Google Analytics Universal Analytics revenue tracking. With the deadline for the sunsetting of GA UA in June 2023, the importance of correctly setting up GA4 and integrating it with Google Ads was a high priority. Ruby Digital’s assistance with recommendations to ensure this was setup correctly was integral to Tiki Time Bay Tours as a business and the success of the campaigns.
The tourism industry, particularly boat tours, is competitive and very seasonal.
It proved a challenge to show consistent growth in ad performance considering seasonality of cruise tours with booking peaks in the warmer months especially in San Diego.
A challenge encountered from Google Ads is the clients resistance to relinquishing control of the account and insisting on continuing to run their own campaigns. To differentiate the campaigns managed by Ruby Digital versus the client, we implemented Labels and consistently created comparisons between the campaigns to show value through performance improvements.

September 2023 compared to July 2023 (quarterly comparison):
Meta Ads:
Google Ads:
Ruby Search Solutions (Pty) Ltd trading as Ruby Digital
"*" indicates required fields
"*" indicates required fields